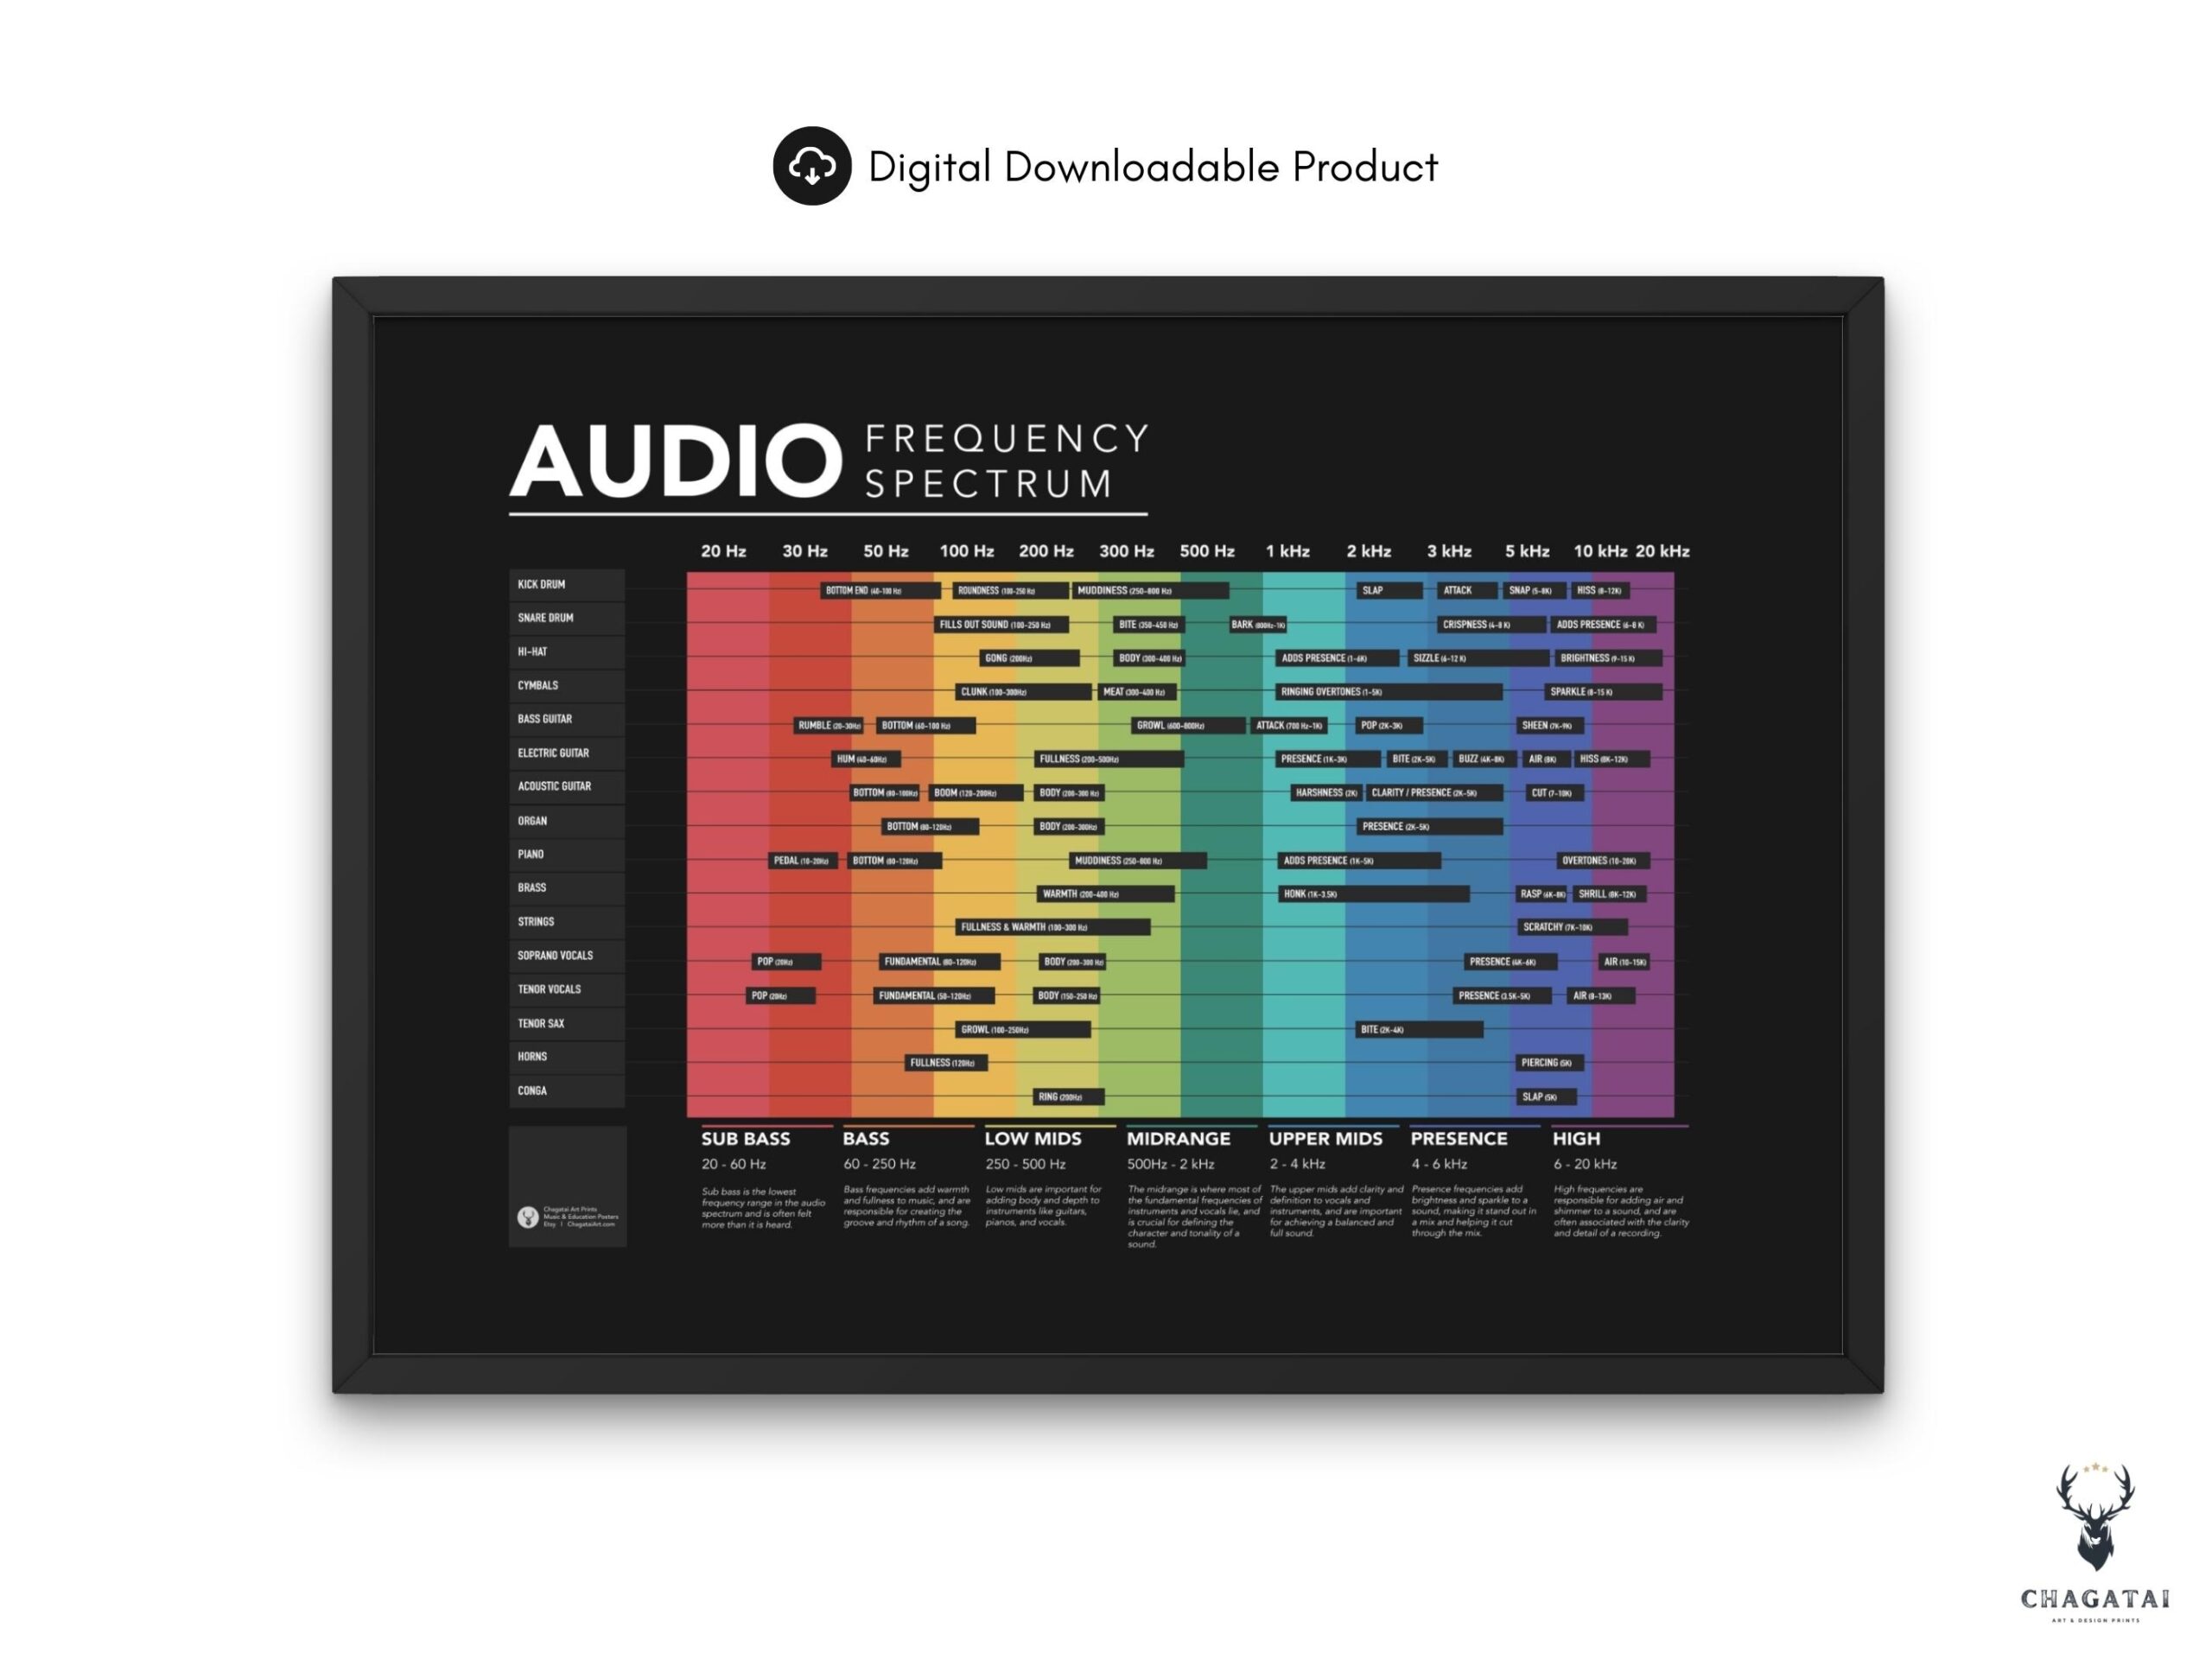
The Audio Spectrum Infographic Chart Printable is a fantastic resource for parents and educators looking to enhance their understanding of sound frequencies. This chart visually represents the range of audible sound, making it easier to grasp concepts related to audio, music, and sound science. By using this printable, you can help your children or students better understand the various frequencies of sound and their applications in everyday life.
Understanding the Audio Spectrum
The audio spectrum is divided into various frequency ranges, each associated with different types of sounds. The main categories include:
- Infrasound (0.1 Hz – 20 Hz): Sounds below the limit of human hearing. These frequencies can be felt rather than heard and are often produced by natural events like earthquakes.
- Bass (20 Hz – 250 Hz): Low-frequency sounds that provide depth and richness to music. Think of the rumble of a bass guitar or the thump of a kick drum.
- Midrange (250 Hz – 2000 Hz): This range includes most of the sounds we hear daily, including human speech and most musical instruments.
- Treble (2000 Hz – 20,000 Hz): High-frequency sounds that add clarity and detail, such as cymbals or the high notes of a piano.
When you download the Audio Spectrum Infographic Chart Printable, you’ll get a clear visual breakdown of these categories, helping to illustrate the differences and importance of each frequency range.
How to Use the Audio Spectrum Infographic Chart
Once you have the chart printed out, there are several practical ways to incorporate it into learning activities:
- Classroom Lessons: Use the chart as a teaching aid when discussing sound waves and their properties. It can help students visualize the concepts you’re explaining.
- Home Projects: Encourage your children to explore sound by creating their own sound experiments. Have them play different instruments or use household items to generate sounds across different frequencies, referring to the chart to identify the ranges.
- Music Analysis: If your child is learning an instrument or studying music, this chart can help them understand the role of different frequencies in their practice and performance.
Preparing to Print and Use the Chart
Before you hit print, there are a few things to consider to ensure the best results:
- Paper Type: For durability, consider printing on cardstock. This material holds up better if you want to laminate the chart for repeated use.
- Print Settings: Set your printer to the highest quality for the best color representation. If you have access to a color printer, that’s ideal, as the colors will help differentiate the frequency ranges.
- Size Options: The chart is typically designed for standard letter size (8.5” x 11”). If you prefer a larger version, check if the resource offers a PDF that can be resized for poster printing.
Where to Use the Chart at Home
Once your Audio Spectrum Infographic Chart Printable is ready, think about where it can be most useful in your home:
- Study Area: Hang it in your child’s study area as a reference while they work on projects related to sound.
- Music Room: If you have a dedicated space for music practice, placing the chart there can serve as a constant reminder of the different frequencies they’re working with.
- Home Science Corner: If you engage in regular science experiments, this chart can be a great addition to your home science resources, linking sound experiments with scientific principles.
Enhancing Learning Through Visualization
Visual aids like the Audio Spectrum Infographic Chart Printable are crucial for reinforcing learning. Children often grasp abstract concepts better when they can see them represented visually. This chart not only serves as a reference but also sparks curiosity and encourages exploration in the realm of sound.
For example, while studying the concept of sound waves, children can refer to the chart to understand how different sounds fit into the audio spectrum. This can enhance discussions about music, audio technology, and even environmental sounds.
Additional Tips for Effective Use
- Interactive Learning: Pair the chart with audio samples of different frequencies. Websites and apps that allow you to play sounds at various frequencies can make this learning experience more engaging.
- Art Projects: Have your kids create their own infographics or art projects based on their understanding of sound frequencies. This activity can reinforce what they’ve learned while allowing them to express their creativity.
- Family Discussions: Use the chart as a conversation starter about music and sound in your family. Discuss your favorite instruments, songs, or sounds and where they fit within the spectrum.
By integrating the Audio Spectrum Infographic Chart Printable into various learning experiences, you’re not just providing a tool; you’re fostering an environment where sound and music can be appreciated and understood on a deeper level.
For immediate action, print the chart today and start planning fun sound-related activities with your children. Encourage them to explore and ask questions about the sounds they hear every day!